Reliability Analysis of Gluteus Maximus Muscle Cross-Sectional Area Measurements Using Two Different Image Analysis Programs
Gary Anthony Auyong Wu, MS, Kath Bogie, DPhil
ABSTRACT
Axial pelvic computer tomography x-ray (CT) scans of nine patients with spinal cord injury (SCI) implanted with a gluteal electrical stimulation system (GSTIM) were examined using ImageJ and VeVMD image analysis software programs to measure the cross-sectional area of the gluteus maximus muscle. The measurements were performed by a set of two non-expert raters to compare the reliability of the two image analysis programs for use in longitudinal cross-sectional area changes in muscle. In addition, longitudinal measurements of one patient were rated by two expert and two non-expert raters. The difference in the measurements between ImageJ and VeVMD were significant for three of the four raters (p<0.05). Standard deviations of each rater using ImageJ is ±2.5cm2 for all raters and standard deviations for VeVMD is 4.4 cm2 and 3.7 cm2 for non-expert and 2.7 cm2 and 2.5cm2 for expert raters. In both programs, significant changes in cross-sectional area of electrically-stimulated gluteus maximus muscle were observed for one patient over a period of two years.
KEYWORDS
Muscle cross-sectional area, image analysis, repeated measures, reliability, electrical stimulation.
BACKGROUND
Immediately after SCI muscles innervated by nerves beneath the level of injury exhibit widespread loss of muscle mass in the first 6 weeks. Rapid muscle atrophy can be seen in an average of 45-80% reduction in muscle cross-sectional area (CSA). Of these patients 20-30% is estimated to have or have a history of pressure ulcers at 5-10 years post-injury respectively. Most pressure ulcers are partial thickness (Stage I and II) and for patients in a healthcare setting most frequently occur at the bony prominences of the sacrum or coccyx with the second most frequent site of occurrence at the heel. It has been shown that previous incidence of pressure ulcer is the most significant factor in predicting development of future pressure ulcers suggesting that preventive methods must be pursued.
Electrical stimulation (ES) has been shown to have efficacy in dynamically varying the pressure under the bony prominences by redistributing the interface pressure and simulating weight-shifting strategies. , Varying the pressure alleviates mechanical occlusion and permits increased blood and lymph flow. Additionally, the rhythmic muscle contractions can act as a pump leading to increased blood flow and thus oxygen supply to the muscle tissue. , In SCI, the potential for maintenance of muscle bulk even after loss of function suggests that one may use rehabilitation or functional electrical stimulation to condition the muscle and recover muscle mass and decease fatigue. Chronic stimulation of muscle can improve fatigue resistance and enhance aerobic capacity of muscle, increase capillary density, vascularization, contractile strength and muscle bulk. , These positive changes suggest that electrical muscle stimulation can be used as an effective long-term prevention strategy for pressure ulcers.
Although immediate effects can be measured there has been little evidence on the long-term effectiveness of electrical stimulation and how it affects the stimulated muscle. In this paper, we propose the use of image analysis software as a means to quantify the cross-sectional area measurements of the gluteus maximus muscle over a period of time. An initial requirement is to establish the reliability and repeatability of measurements. We can then use this measure to show the longitudinal effects of ES on the cross-sectional area of the stimulated muscle.
METHODOLOGY
Retrospective axial CT scans of the gluteus maximus muscle were used to assess the effects of ES on muscle cross-sectional area measured by two image analysis programs. Although MRI is considered the gold standard for measuring muscle area, CT measurements are comparable and were chosen over MRI to prevent contraindications for patients with implants. Scan locations were determined by anatomical landmarks; where the caudal head of the femur starts to appear (pelvic) and where the lateral aspect of the greater trochanter is most prominent (sacral). Scans from 9 patients were taken at different time intervals within 2 years after electrode implantation giving a total of 26 image sets. The 26 image sets were de-identified and randomized before being analyzed with either ImageJ or VeVMD by 2 non-expert raters, additionally a subset of 6 image sets were then analyzed by the 2 expert raters. Cross-sectional muscle area measurements were performed by first locating the specified muscle, then outlining the muscle fascia, taking care not to include tendons and ligaments. To compare the intra-rater reliability, each rater was asked to repeat the analysis of the image 3 times for each program; measurements were taken at intervals of 1-2 weeks to test repeatability.
Reliability and Repeatability Analysis
Bland-Altman analysis was used to assess agreement between measurements taken using ImageJ and VeVMD. , A paired t-test was done with a 95% confidence interval to assess the difference between measurements from the two image analysis programs.
Longitudinal Statistical Analysis
To study the effects of ES on CSA, four raters, were asked to perform the same measurements as described above for a patient with four datasets acquired over a period of two years; immediately after implantation as 0 months, and 6-, 12- and 24-months post-implantation.
A general linear model ANOVA was used to test the significance of the raters (Raters), image analysis programs (Program) and repeated measurements over time (Longitudinal). Tukey’s pairwise comparisons were used to compare the difference in measurements between the different time points for the ‘Longitudinal’ factor to see whether cross-sectional muscle area changed significantly.
RESULTS
Statistical Analysis
We used the intrarater analysis to compare whether the two image analysis tools are comparable for muscle measurement. Taking the average of the 3 measurements for each image, we can minimize the training bias that occurs over time as more measurements are done by the rater. We saw that with the same rater the same analysis program produces comparable means. Thus either program can be used for measuring the muscle within two times the standard deviation.
The reliability and repeatability of measurements for each of the four rater can be measured via the standard deviations using either ImageJ or VeVMD. The standard deviation for ImageJ was ±2.5cm2, while standard deviations for VeVMD were 4.4 cm2 and 3.7 cm2 for non-expert (raters 1, 2) and 2.7 cm2 and 2.5cm2 for expert raters (raters 3, 4) with cross-sectional area measurements between 20-45 cm2 for 20 images repeated 3 times. (Table 1)
STDEV |
Rater 1 |
Rater 2 |
Rater 3 |
Rater 4 |
|---|---|---|---|---|
ImageJ |
2.523 |
2.625 |
2.635 |
2.493 |
VeVMD |
4.419 |
3.630 |
2.734 |
2.537 |
The standard deviations by the non-expert raters (1, 2) were lower for ImageJ then when compared to VeVMD with cross-sectional area measurements of 5-45 cm2 for 134 images repeated 3 times (Table 2)
STDEV |
Rater1 |
Rater2 |
|---|---|---|
ImageJ |
1.546 |
2.391 |
VeVMD |
2.387 |
2.948 |
To test the reliability among raters (interrater) we compared the measurements of the two non-expert raters when using the same imaging program. Differences increased proportionally to the size of the muscle and can be as much as 15-20% of the average muscle size.
To compare the reliability of measurements between programs a paired t-test was used to compare the measurements taken from ImageJ and from VeVMD Differences for measurements between the two programs are significant for raters 1, 2 and 4. (Table 3)
|
ImageJ Mean(cm2) |
VeVMD mean(cm2) |
ImageJ –VeVMD (cm2) |
t-value |
95% CI |
p-value |
|---|---|---|---|---|---|---|
Rater 1 |
31.44 |
32.85 |
-1.416 |
-2.13 |
-2.791 to -0.042 |
0.044* |
Rater 2 |
37.17 |
39.70 |
-2.529 |
-3.34 |
-4.095 to -0.962 |
0.003* |
Rater 3 |
23.05 |
22.52 |
0.535 |
0.91 |
-0.682 to 1.752 |
0.373 |
Rater 4 |
23.07 |
24.64 |
-1.564 |
-3.48 |
-2.492 to -0.635 |
0.002* |
Longitudinal Study
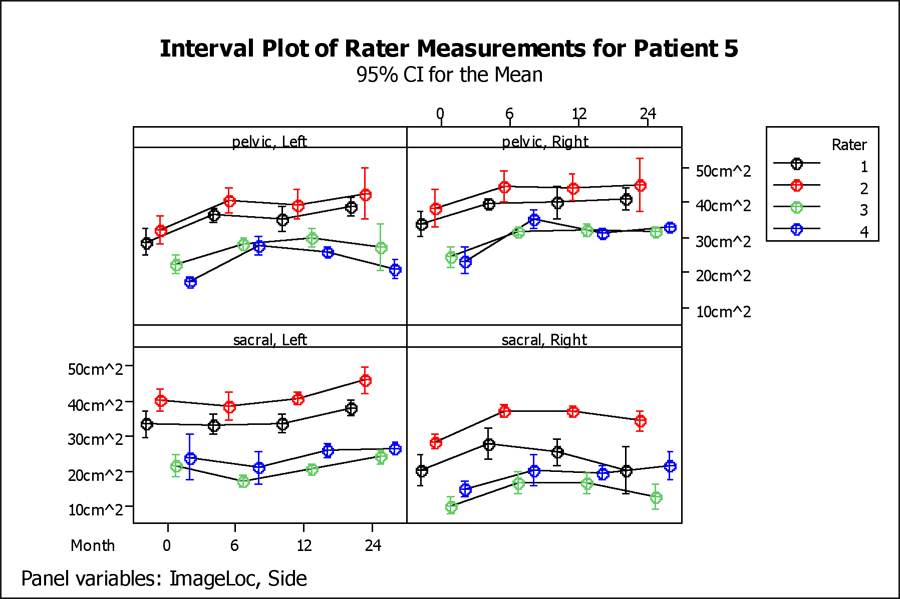 Figure 1. (Click for larger view)
 The longitudinal analysis for a single patient over a period of 4 time points (Figure 1) show an increase in muscle size post-implantation. The Tukey’s comparison test showed that the difference in longitudinal measurements of right sacral area and the left and right pelvic area were significant only when compared to time 0 (p<0.05). After month 6 differences were not significant except for the left sacral area. (Figure 2)
DISCUSSION/CONCLUSION
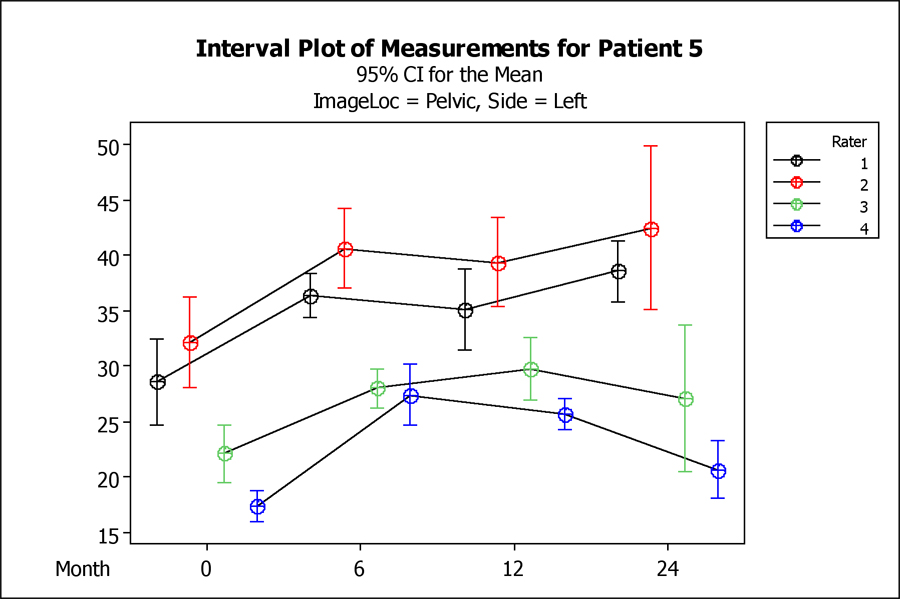 Figure 2. (Click for larger view)
 The significant differences in measurements between non-expert raters and similar measurements only with the two expert raters for ImageJ suggest that the same rater should be used to assess longitudinal cross-sectional area measurements. This may limit researchers to shorter studies or to retrospective scans. The Bland-Altman analysis showed that the frequency of outliers increases with the magnitude of the muscle measurement. The smaller measurements reported by the expert raters further suggest that it may be possible to train raters or to have more stringent criteria for considering the boundaries of cross-sectional muscle area; it is possible that inclusion of other tissues, such as tendon, fat and other muscles was a cause of the observed variability and larger measurements. It is possible to use computer-aided diagnosis software in the image analysis programs to outline the boundaries of the specific muscle of interest, ranging from simply increasing the high frequency content of the image to help outline the boundaries to performing watershed techniques to color the area of interest. These analysis tests may be useful in improving reliability and reproducibility.
In a person with disuse muscle atrophy, not only does the cross-sectional muscle area get smaller but the muscle tissue becomes infiltrated with fat leading to lower fat-free muscle mass. A simple CSA measurement cannot capture these changes; it is possible to have the CSA plateau over time while the relative percentages of fat and fat-free tissue in the muscle are significantly altering. Fat and muscle have different gray values in a CT scan; we may be able to use this intrinsic feature in CT scans to address the issue of fat content and to measure the relative percentage of fat and fat-free tissue.
We show that there is significant variability in the measurements between raters however there is insignificant variability in the same rater. Measurement differences between programs are significant and it would be optimal to standardize the image analysis program for each study. Using the same rater and program, we can measure significant changes in muscle cross-sectional area of a muscle receiving electrical stimulation over a period of time.
REFERENCES
- Castro MJ, Apple Jr DF, Hillegass EA, Dudley GA (1999) Influence of complete spinal cord injury on skeletal muscle cross-sectional area within the first 6 months of injury. Eur J Appl Physiol 80:373-378.
- Johnson RL, Gerhart KA, McCray J, Menconi JC, Whiteneck GG (1998) Secondary conditions following spinal cord injury in a population based sample. Spinal Cord; 36:45-50.
- Fuhrer MJ (1991) Rehabilitation research and training center in community-oriented services for persons with spinal cord injury: a progress report. Houston: Baylor College of Medicine, Institute for Rehabilitation and Research.
- Whittington KT, Briones R (2004) National Prevalence and Incidence Study: 6-Year Sequential Acute Care Data Advances in Skin & Wound Care; Nov/Dec 2004; 17, 9; pp. 490-494
- McGlinchey-Berroth R, Morrow L, Ahlquist M, Sarkarati M, Minaker KL (1995) Late-life spinal cord injury and aging with a long term injury: characteristics of two emerging populations. J Spinal Cord Med 18:183-93.
- Levine SP, Kett RL, Cederna PS, Bowers LD, Brooks SV (1989) Electrical muscle stimulation for pressure variation at the seating interface. J Rehabil Res Dev; 26(4):1-8
- Levine SP, Kett RL, Cederna PS, Bowers LD, Brooks SV (1990) Electrical muscle stimulation for pressure sore prevention: tissue shape variation. Arch Phys Med Rehabil; 71:210-5
- Levine SP, Kett RL, Gross MD, Wilson BA, Cederna PS, Juni JE. (1990) Blood Flow in the Gluteus Maximus of Seated Individuals during Electrical Muscle Stimulation. Arch Phys Med Rehabil; 71:682-6
- Liu MS, Grimm DR, Teodorescu V, Kronowitz SJ, Bauman WA. (1999) Transcutaneous oxygen tension in subjects with paraplegia with and without pressure ulcers: A preliminary report. Journal of Rehabilitation Research & Development. July 1999; 36(3)
- Kern H, Rossini K, Boncompagni S, Protasi F, Hofer C, Modlin M, Carraro Ugo (2005) Long Lasting muscle trophism in complete upper motor neuron lesion paraplegia. Basic Appl Myol 15 (5&6):191-201
- Hudlicka O, Brown M, Cotter M, Smith M, Vrbova G. (1977) The effect of long term stimulation of fast muscles on their blood flow, metabolism and ability to withstand fatigue. Pflugers Arch. 369:141-149
- Dudley GA, Castro MJ, Rogers S, Apple DF Jr (1990) A simple means of increasing muscle size after spinal cord injury: a pilot study. Eur J Appl Physiol 80:394-396
- Stein RB, Gordon T, Jefferson J, Sharfenberger A, Yang JF, Totony De Zepetnek J, Belanger M. Dk. Optimal stimulation of Paralyzed Muscle after human spinal cord injury. American Physiological Society 992, 1393-1400
- Bogie KM, Wang X, Triolo RJ (2006) Long-term prevention of pressure ulcers in high-risk patients: A single case study of the use of gluteal neuromuscular electric stimulation. Arch Phys Med Rehabil (87):585-591 April 2006
- Mitsiopoulos N, Baumgartner RN, Heymsfield SB, Lyons W, Gallagher D, Ross R. (1998) Cadaver validation of skeletal muscle measurement by magnetic resonance imaging and computerized tomography. J Appl Physiol 85: 115-122,
- Bland MJ, Altman DG. (1986). Statistical Methods for assessing agreement between two methods of clinical measurement.Lancet, i, 307-310
- Warfield SK, Zou KH, Wells WM. (2006) Validation of Image Segmentation by Estimating Rater Bias and Variance. MICCAI 2006, LNCS 4191, pp839-847
ACKNOWLEDGEMENTS
Committee Members: Kath Bogie, DPhil, Horst von Recum PhD, Chester Ho, MD
Statistical Consultation: Xiaofeng Wang, PhD, Steven Sidik, PhD, Monique Washington RN, MS
Muscle Raters: Saad MD, Rochon MD, Jonathan Olbricht, BS, Gary Wu, MS
Radiology Department: Nanette Alvarado MD, Ron Lew MD
Valuable Assistance: Jonathan Sakai, MSME, Patricia Banks, RN, BSN, Christine Wu, MS.
CONTACT INFORMATION
Gary Anthony Auyong Wu, MS
c/o Cleveland FES Center
Motion Studies Laboratory
Mail Stop W151-A
VA Medical Center
10701 East Boulevard
Cleveland, Ohio 44106-1702
(216) 421-3099 / (216) 231-8886 Fax
E-mail: gaw11@case.edu